
Features
Explore the changing air quality over London using air pollution maps. Discover your vulnerability to predicted air pollution with the exposure record. Take the healthiest route by avoiding the worst polluted areas.
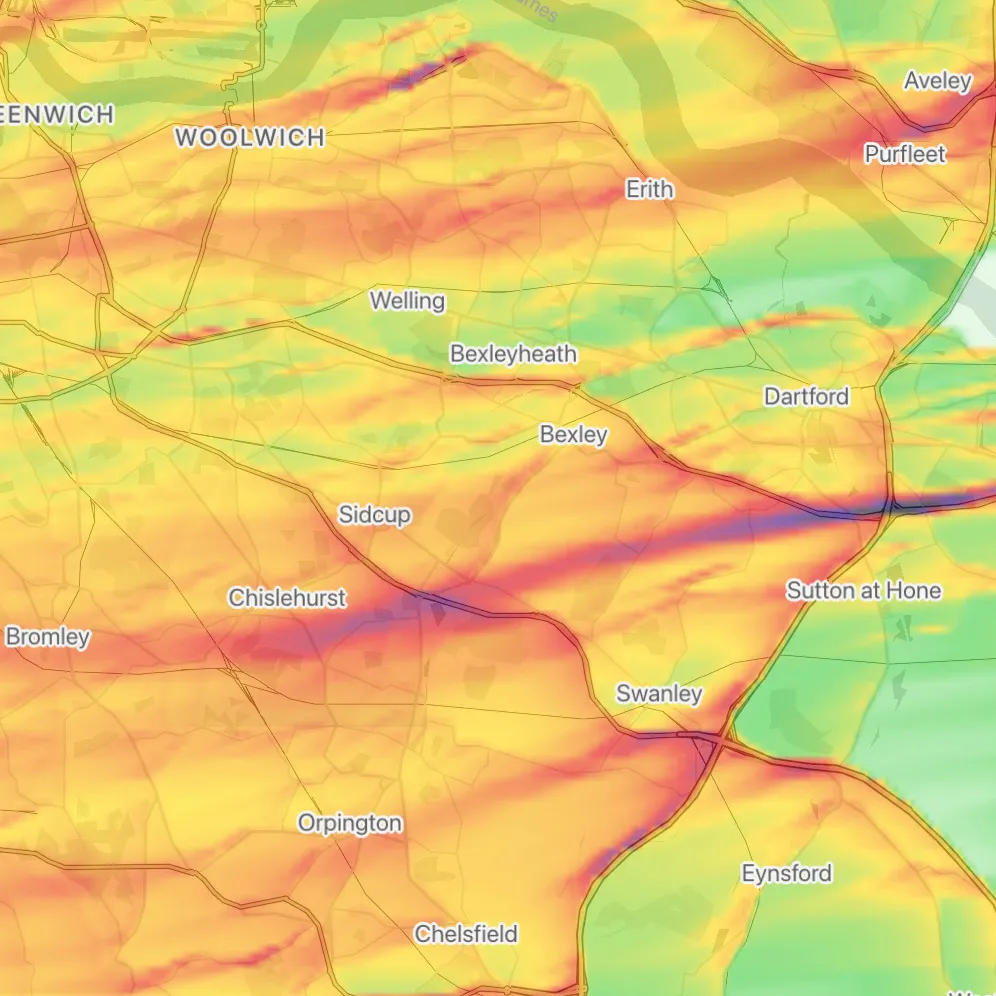
Air pollution map
Today’s four pollutants
Air pollution maps combining live traffic data and other fossil fuel emissions modelled with hourly weather conditions. See how the air pollutants drift over the city and effects of heavy traffic on air quality.
exposure record
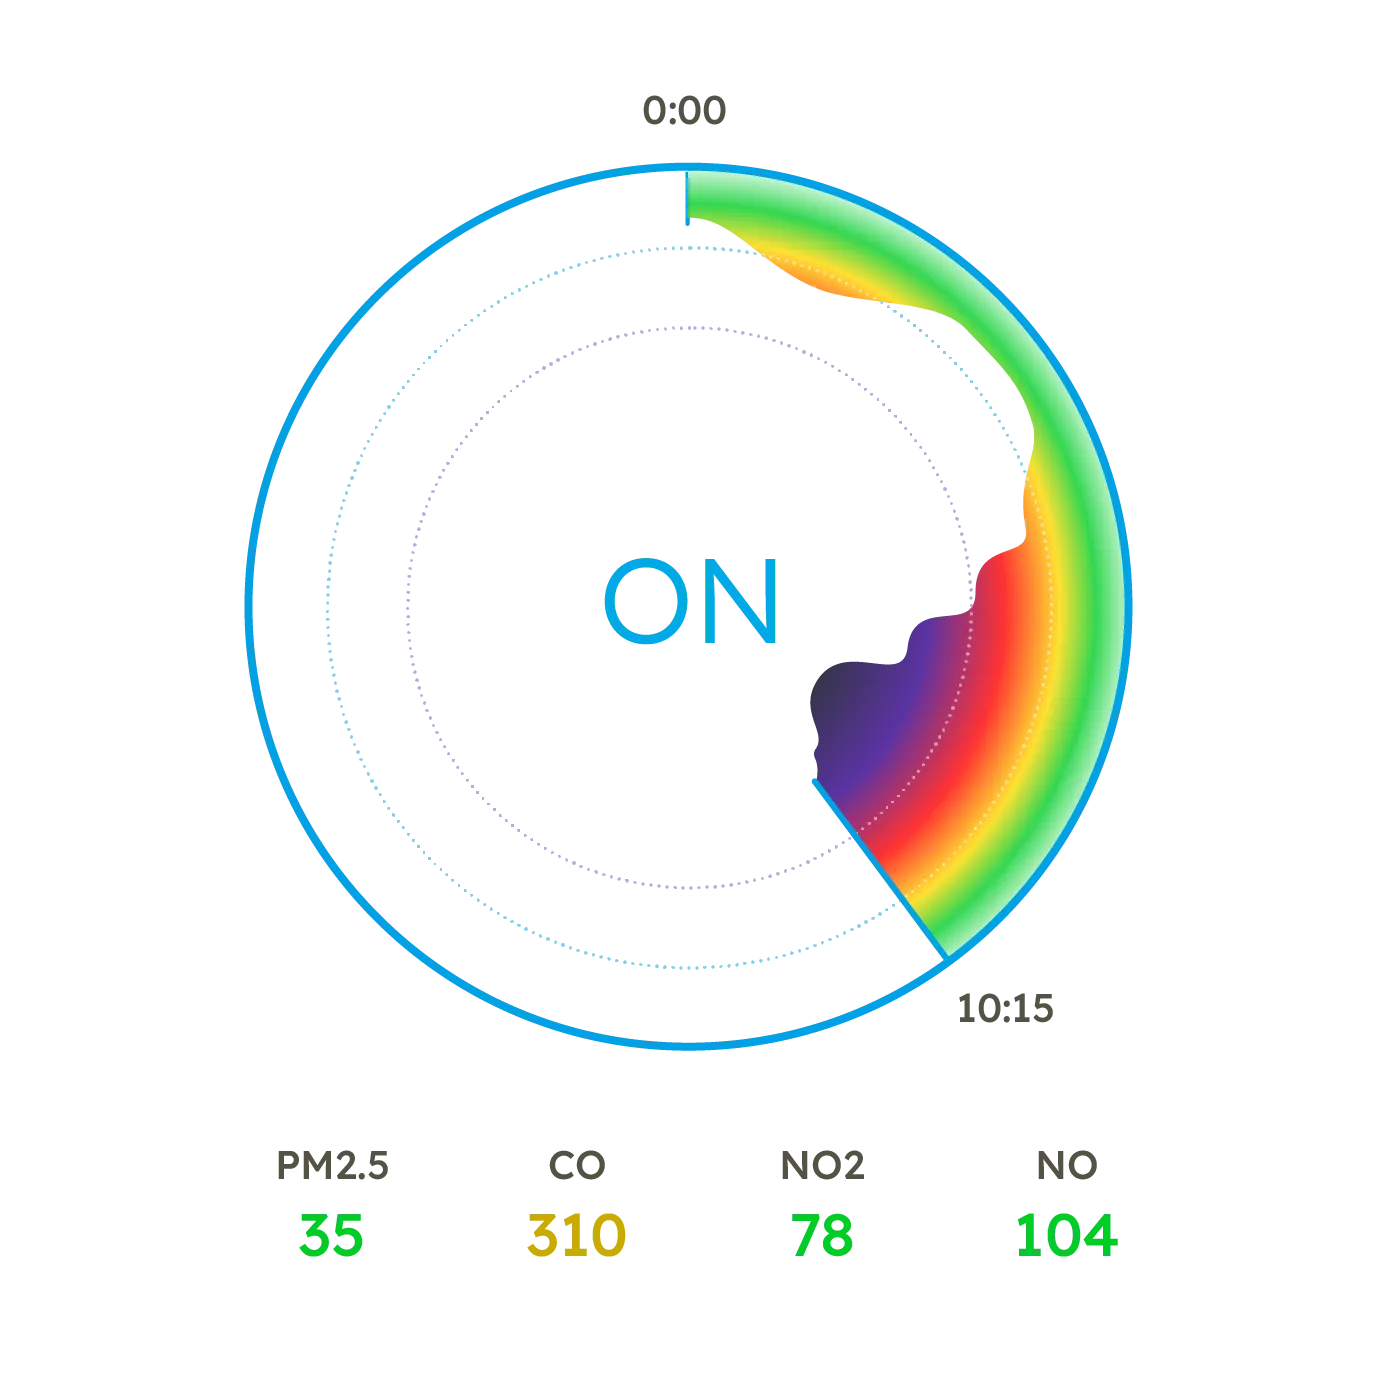
Today in micrograms
Exposure information based on location in the air pollution map.
Whether at home or using the healthy navigation your exposure to four pollutants is recorded in micrograms.
Allowing you to take control of your exposure and change your daily & weekly routine and see the benefits.
healthy navigation
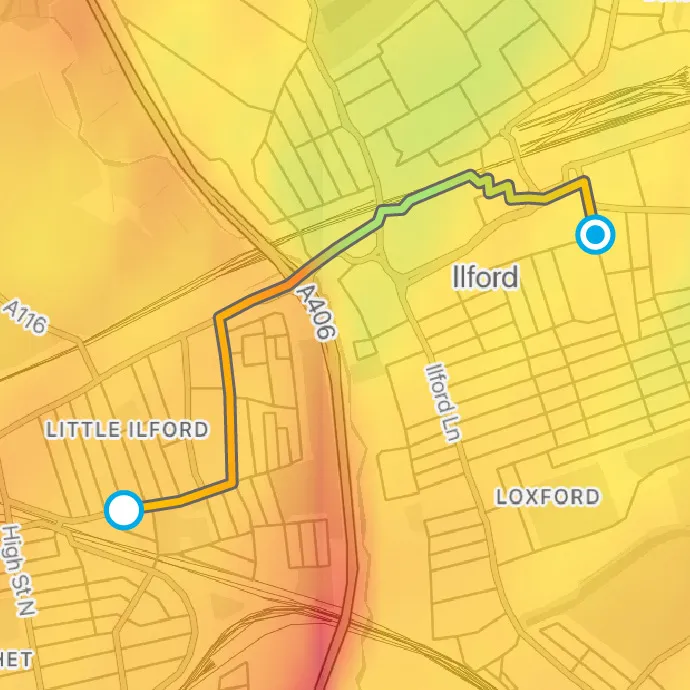
Today’s healthiest route
Choose the healthiest route to any destination when walking, running or cycling, and follow the cleanest air.
Your healthy route exposure to the modelled air pollution is calculated in high-resolution, step-by-step, and you can replay the trip.